Project 1 Data Visualization
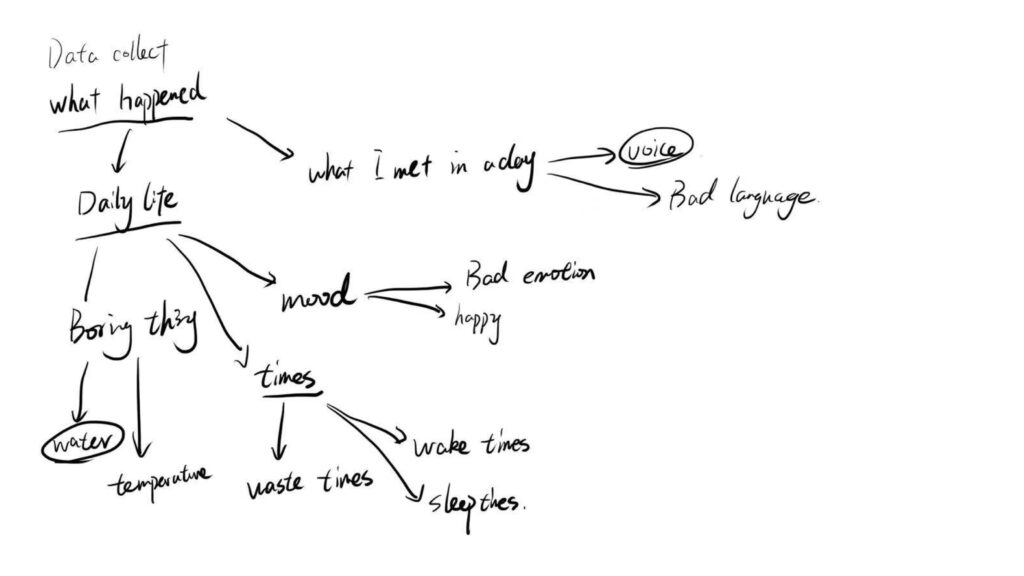
This project is data visualization. First of all, I think it is necessary to collect data comprehensively. The best time span is long enough to collect a large amount of data for analysis. During the analysis, I chose several different directions, and finally decided to conduct research on the theme of daily life and found some interesting things in daily life.
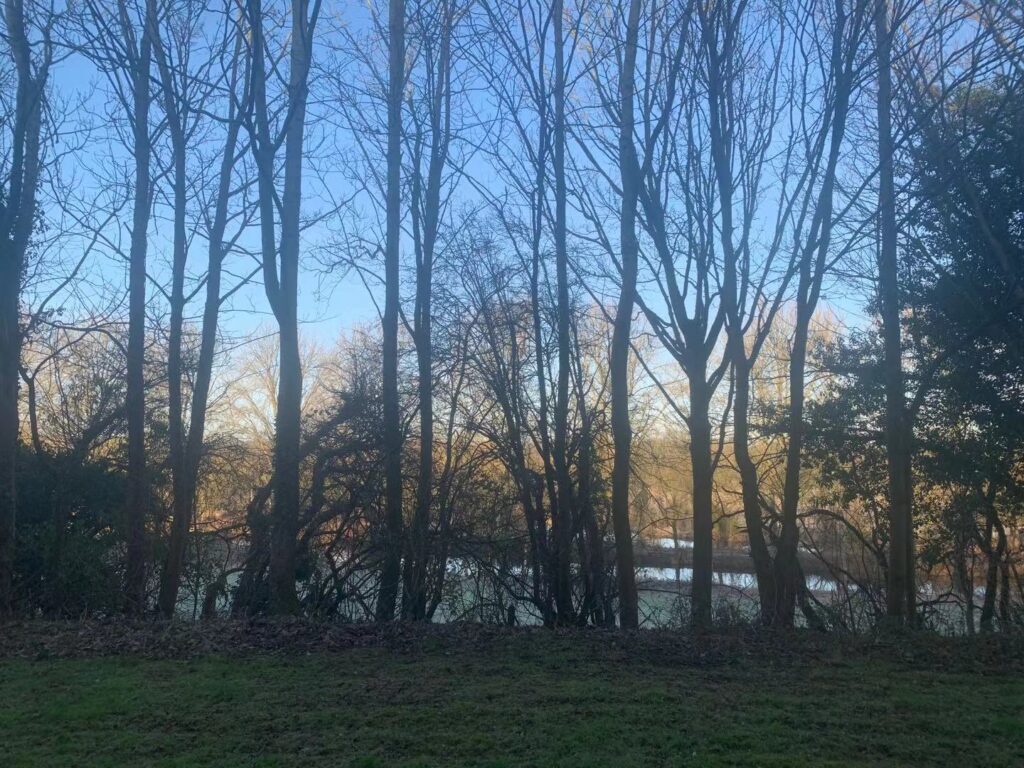
While recording, I took some photos as well as video for the record.
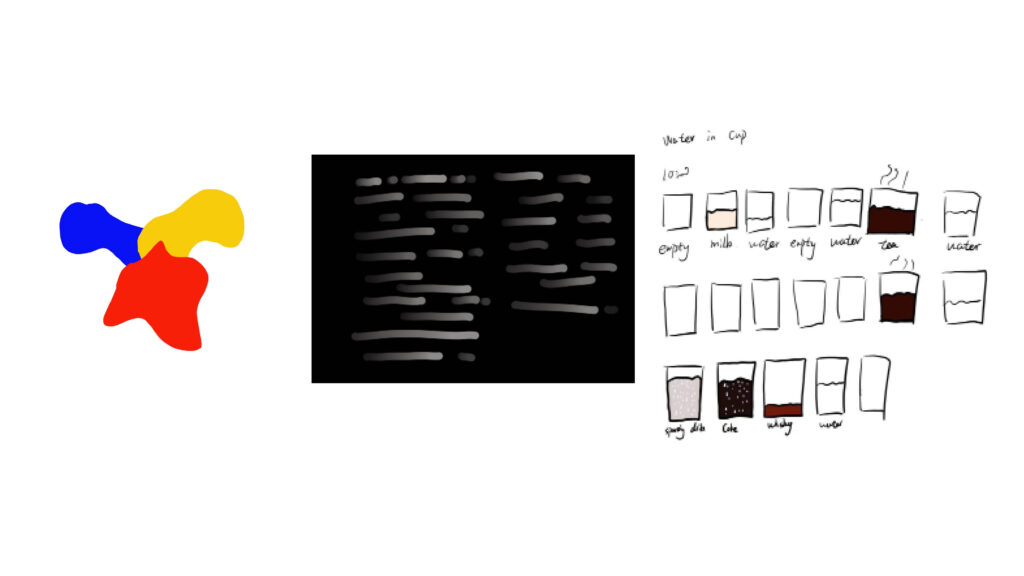
In addition, I recorded some other changes by hand drawing, such as the changes of the water cup during the day, and recorded the daily drinking situation.And some sketches were drawn to explore the direction of development.
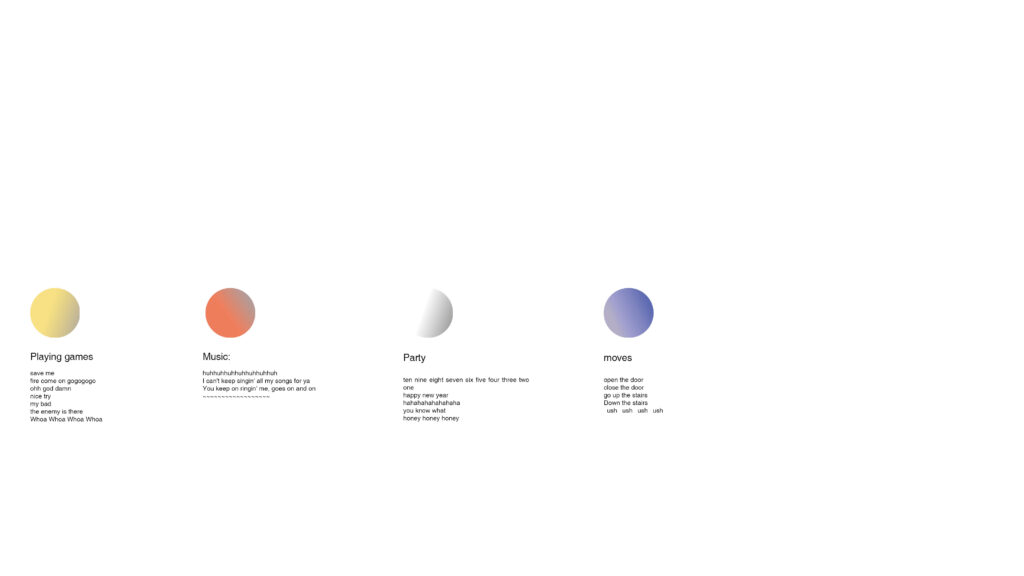

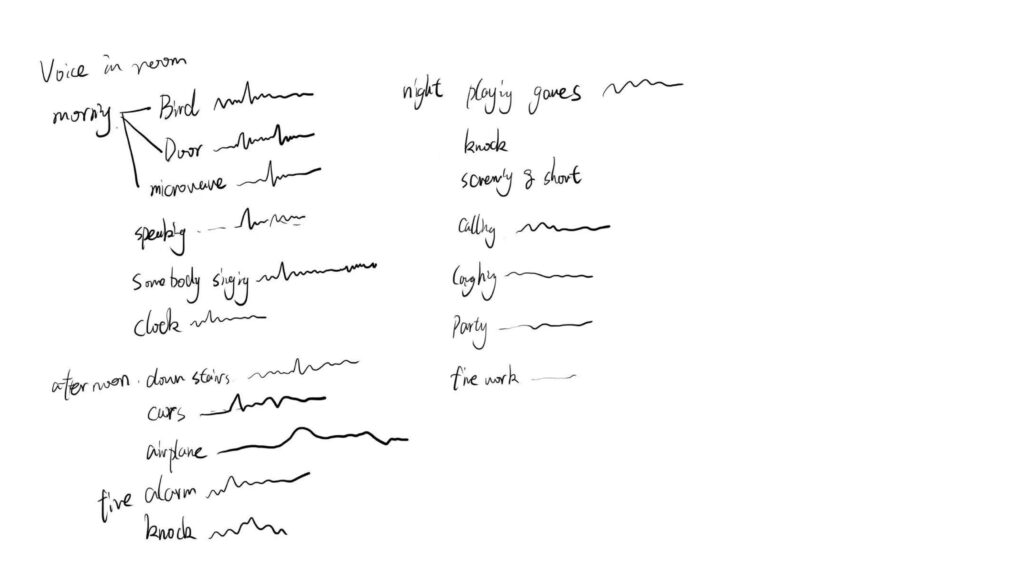
I tried to use different colors to show the noise generation in the room, using yellow to represent the sound of playing games, red to represent the sound of music, white and blue for the sound of party and action, respectively.

The second solution is to record the number of times bad language is spoken per day. During these few days of recording, every time I speak bad language, I will write a number on the notepad. This is the result after recording for several days.
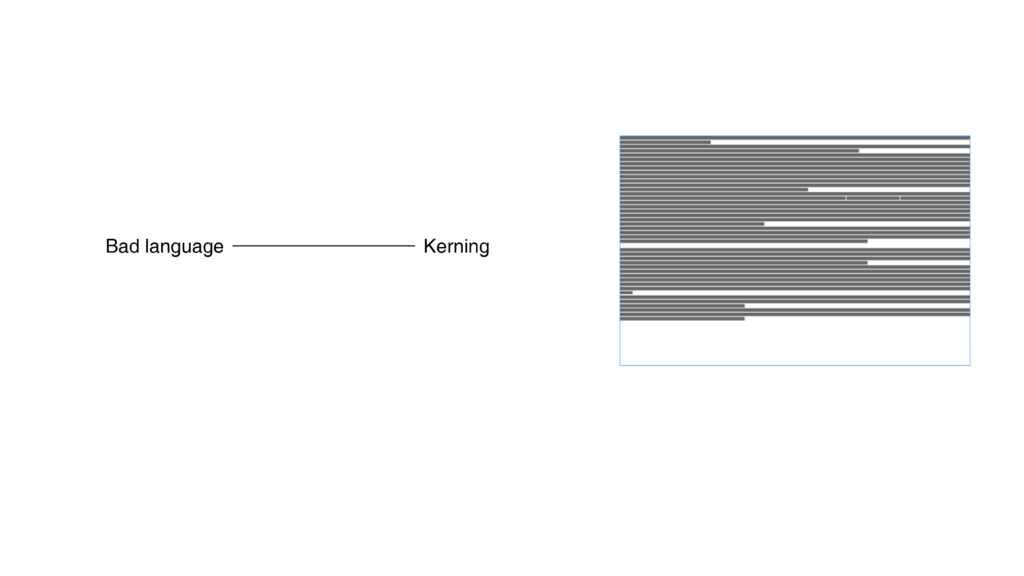
In my opinion, what people say every day, if recorded in writing, will become a thick text like a book. Bad language is always bad, just like typos in books, it will make people uncomfortable, and in Type design, what makes people uncomfortable is some inappropriate Kerning, so I try to use positive and negative space to show and analyze this data.
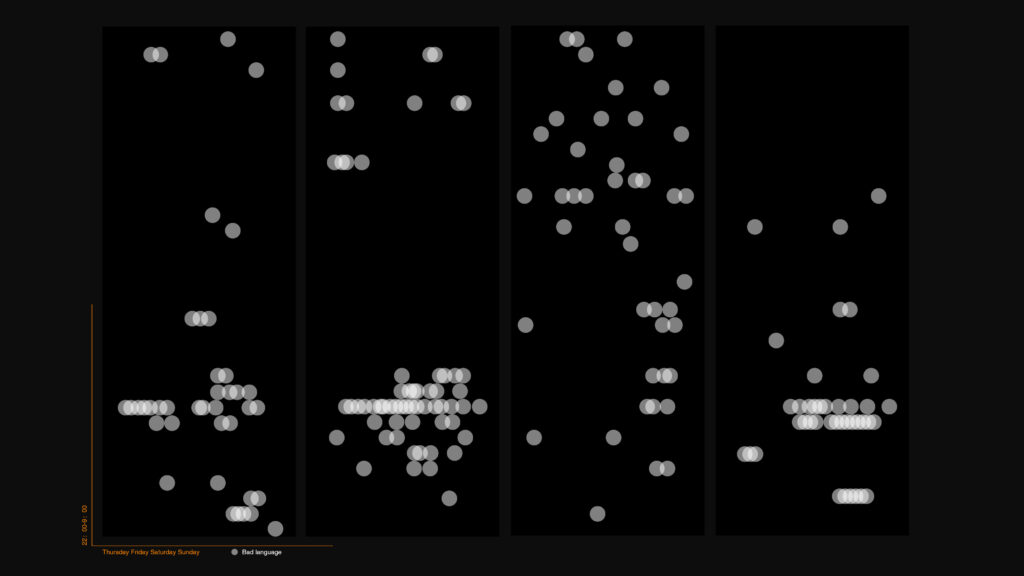
The black part in the figure is all the words spoken every day, the horizontal axis is the number of days and the number of times of use, and the vertical axis is the representative time. I use opacity to create color difference and a sense of space to better show how often bad language is spoken every day.
February 14, 2022